使用prometheus+grafana监控gitlab-runner
github地址:https://github.com/mvisonneau/gitlab-ci-pipelines-exporter/tree/v0.5.4
#首先添加helm仓库,然后把helm包拉下来
helm repo add mvisonneau https://charts.visonneau.fr
helm pull mvisonneau/gitlab-ci-pipelines-exporter
#然后解压进入目录,修改values.yaml
tar zxf gitlab-ci-pipelines-exporter-0.2.18.tgz
cd gitlab-ci-pipelines-exporter
vim values.yaml
#注意:只需要修改config配置即可
config:
# # Complete configuration syntax reference available here:
# # https://github.com/mvisonneau/gitlab-ci-pipelines-exporter/blob/master/docs/configuration_syntax.md
gitlab:
url: https://git-monitor.xxx.xxx #gitlab仓库的地址
token: QeLgp8f2txxxxx #这个token是个人账户创建的令牌,授权api、read_appi、read_repository权限,流程看下面的图1
# enable_health_check: true
# enable_tls_verify: true
projects:
- name: ".*" #这里是通配符,监控所有的项目
# - name: bar/project
# wildcards:
# - owner:
# name: foo
# kind: group
#然后把存活检查、就绪探针给删掉
livenessProbe:
httpGet:
path: /health/live
port: 8080
readinessProbe:
httpGet:
path: /health/ready
port: 8080
initialDelaySeconds: 5
timeoutSeconds: 5
failureThreshold: 3
periodSeconds: 30
#然后部署在defalut命名空间即可
helm upgrade --install gitlab-ci-pipelines-exporter mvisonneau/gitlab-ci-pipelines-exporter -f values.yaml
#注意,pod日志的报错可以忽略。创建一个nodeport类型的svc绑定gitlab-ci-pipelines-exporter的8080端口,然后访问接口看是否有数据
例如报错可以忽略,见图2示例:
{"level":"warning","msg":"taskqredisq: pending failed: redisq: can't find pending message id=\"1679976310219-0\" in stream=\"taskq:{default}:stream\"","time":"2023-03-28T08:07:01Z"}
然后创建svc,见图3示例:
gitlab-pipeline-nodeport
然后访问接口查看数据,见图4示例:
http://10.16.0.156:31335/metrics
#然后在prometheus配置文件添加job_name,不需要打标签,否则grfana模板无法识别。target目标地址可以填nodeprot,也可以svc.namespace格式
- job_name: 'gitlab-ci-pipeline'
scrape_interval: 5s
static_configs:
- targets: ['10.16.0.156:31335']
- job_name: 'gitlab-ci-pipeline'
scrape_interval: 5s
static_configs:
- targets: ['gitlab-ci-pipelines-exporter.default.svc.cluster.local:8080']
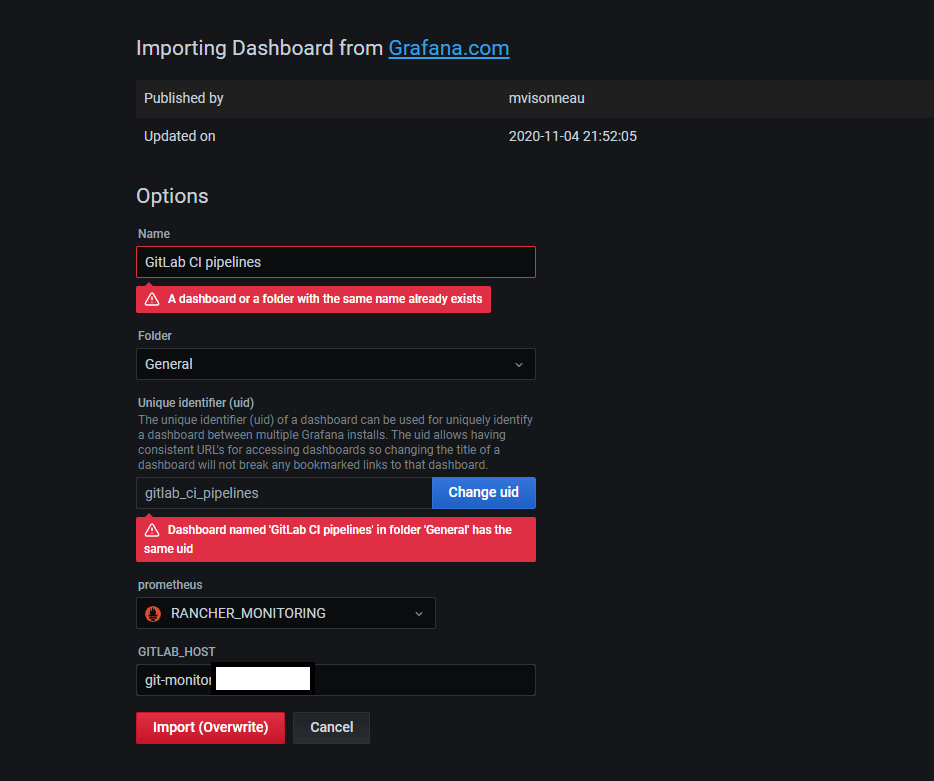
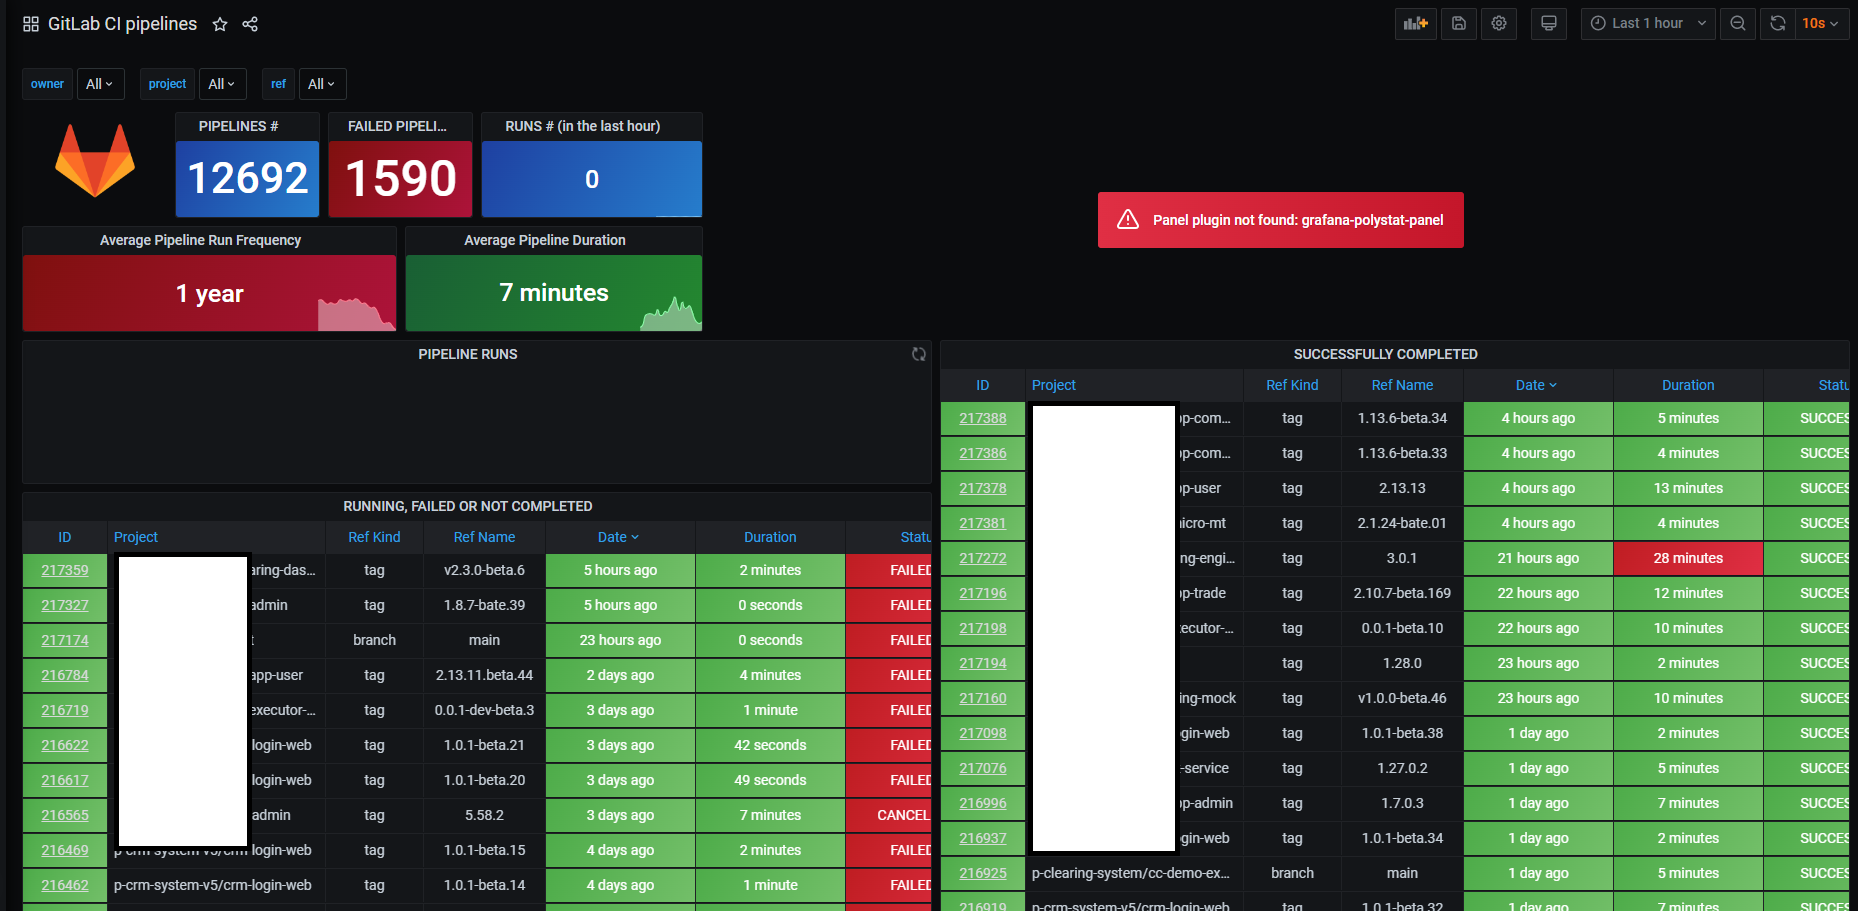
#然后grafana添加模板,导入id为10620。见图5示例
导入id为10620
图1:
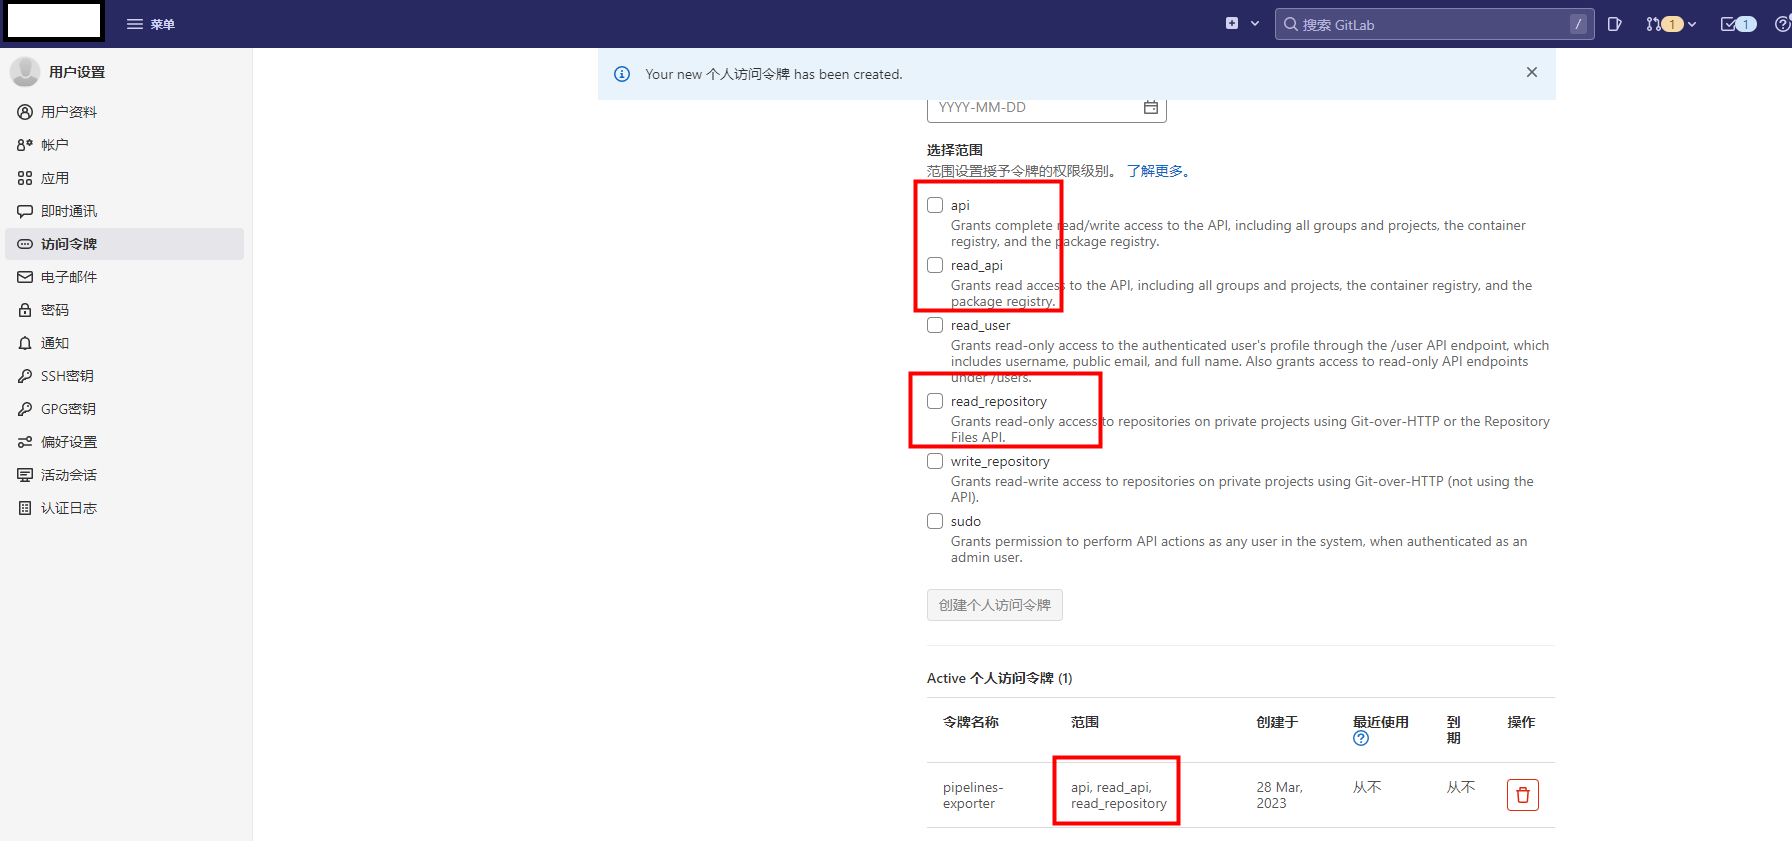
图2:
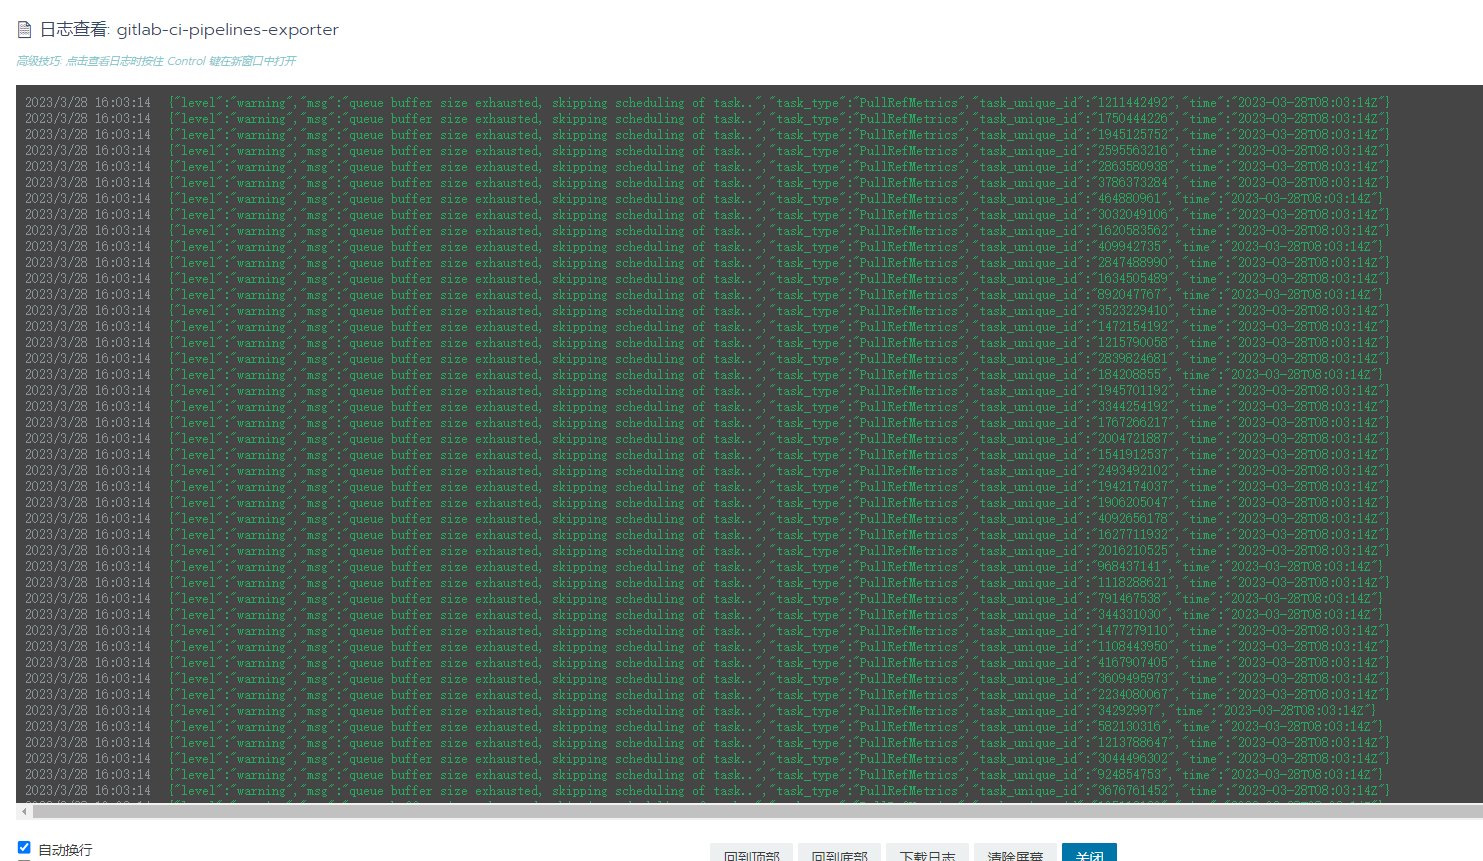
图3:
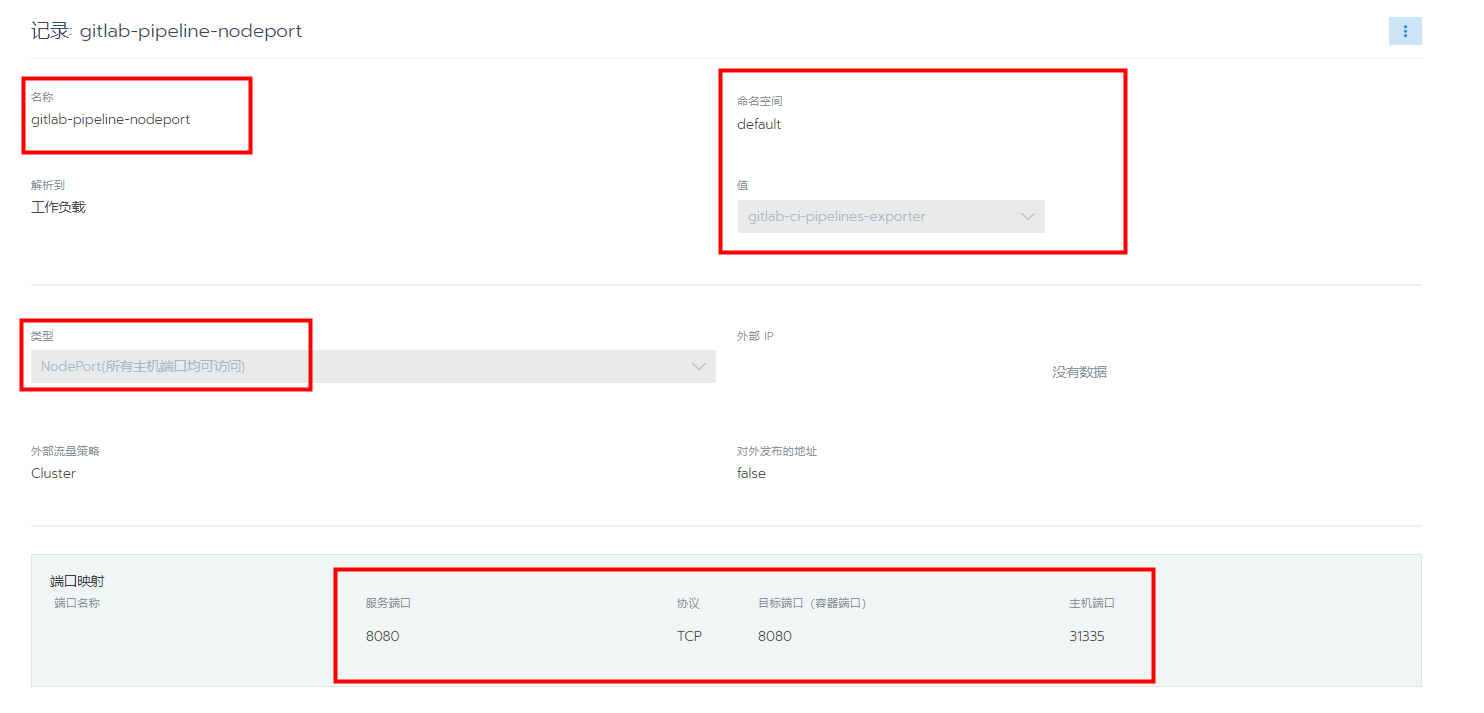
图4:
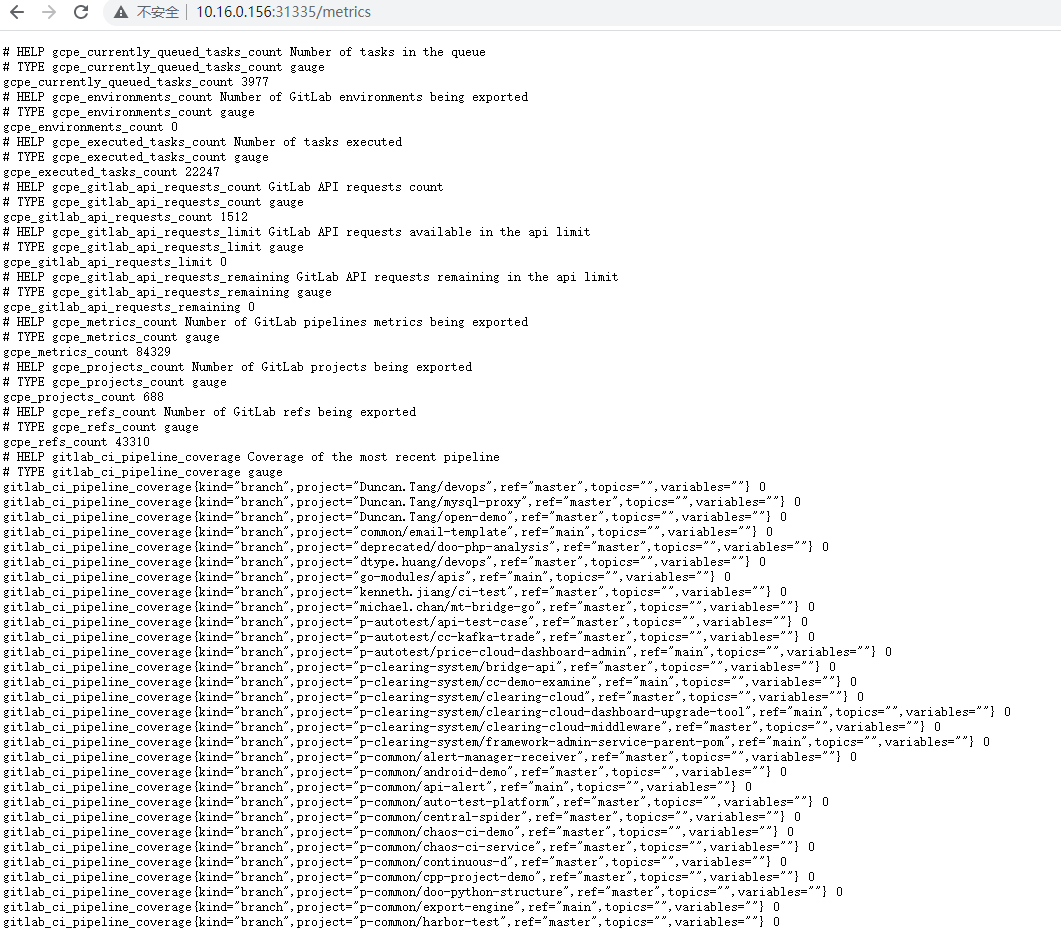
图5: