背景
由于AWS AMP服务不支持香港区域,因此香港区域的EKS需要使用Prometheus监控有两个办法:
- 自建Prometheus
- 使用新加坡或其它区域的AMP服务
下面是跨区域使用AMP的方法
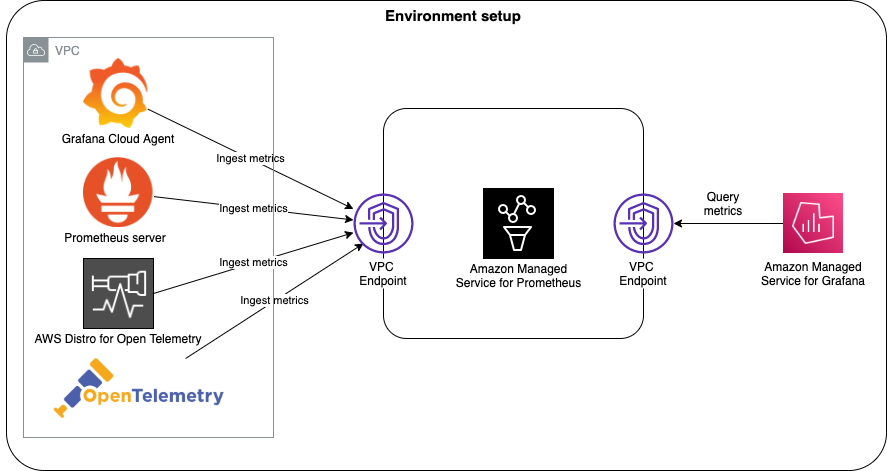
在新加坡区域创建Prometheus的工作区
香港EKS配置新加坡Prometheus的权限
however, we need to set up the required permissions so that the Prometheus server can write into an Amazon Managed Service for Prometheus workspace.
The following shell script can be used to execute these actions on the my-xregion-eks Amazon EKS cluster:
- Create an AWS Identity and Access Management (IAM) role with an IAM policy that has permissions to remote-write into an Amazon Managed Service for Prometheus workspace.
- Create a Kubernetes service account that is annotated with the IAM role.
- Create a trust relationship between the IAM role and the OpenID Connect (OIDC) provider hosted in your Amazon EKS cluster.
#!/bin/bash -e

SERVICE_ACCOUNT_AMP_NAMESPACE=prometheus
AWS_ACCOUNT_ID=$(aws sts get-caller-identity --query "Account" --output text)
OIDC_PROVIDER=$(aws eks describe-cluster --name ${CLUSTER_NAME} --query "cluster.identity.oidc.issuer" --output text | sed -e "s/^https:\/\///")
SERVICE_ACCOUNT_AMP_INGEST_NAME=amp-iamproxy-service-account
SERVICE_ACCOUNT_IAM_AMP_INGEST_ROLE=amp-iamproxy-ingest-role
SERVICE_ACCOUNT_IAM_AMP_INGEST_POLICY=AMPIngestPolicy
#
# Set up a trust policy designed for a specific combination of K8s service account and namespace to sign in from a Kubernetes cluster which hosts the OIDC Idp.
#
cat <<EOF > TrustPolicy.json
{
  "Version": "2012-10-17",
  "Statement": [
    {
      "Effect": "Allow",
      "Principal": {
        "Federated": "arn:aws:iam::${AWS_ACCOUNT_ID}:oidc-provider/${OIDC_PROVIDER}"
      },
      "Action": "sts:AssumeRoleWithWebIdentity",
      "Condition": {
        "StringEquals": {
          "${OIDC_PROVIDER}:sub": "system:serviceaccount:${SERVICE_ACCOUNT_AMP_NAMESPACE}:${SERVICE_ACCOUNT_AMP_INGEST_NAME}"
        }
      }
    }
  ]
}
EOF

function getRoleArn() {
  OUTPUT=$(aws iam get-role --role-name $1 --query 'Role.Arn' --output text 2>&1)
  # Check for an expected exception
  if [[ $? -eq 0 ]]; then
    echo $OUTPUT
  elif [[ -n $(grep "NoSuchEntity" <<< $OUTPUT) ]]; then
    echo ""
  else
    >&2 echo $OUTPUT
    return 1
  fi
}
#
# Create the IAM Role for ingest with the above trust policy
#
SERVICE_ACCOUNT_IAM_AMP_INGEST_ROLE_ARN=$(getRoleArn ${SERVICE_ACCOUNT_IAM_AMP_INGEST_ROLE})
if [ "$SERVICE_ACCOUNT_IAM_AMP_INGEST_ROLE_ARN" = "" ];
then
  #
  # Create the IAM role for service account
  #
  SERVICE_ACCOUNT_IAM_AMP_INGEST_ROLE_ARN=$(aws iam create-role \
  --role-name ${SERVICE_ACCOUNT_IAM_AMP_INGEST_ROLE} \
  --assume-role-policy-document file://TrustPolicy.json \
  --query "Role.Arn" --output text)

  #
  # Attach the required IAM policies to the IAM role created above
  #
  SERVICE_ACCOUNT_IAM_AMP_INGEST_ARN=arn:aws:iam::aws:policy/AmazonPrometheusRemoteWriteAccess

  aws iam attach-role-policy \
  --role-name ${SERVICE_ACCOUNT_IAM_AMP_INGEST_ROLE} \
  --policy-arn ${SERVICE_ACCOUNT_IAM_AMP_INGEST_ARN}
else
    echo "$SERVICE_ACCOUNT_IAM_AMP_INGEST_ROLE_ARN IAM role for ingest already exists"
fi
echo ${SERVICE_ACCOUNT_IAM_AMP_INGEST_ROLE_ARN}
#
# EKS cluster hosts an OIDC provider with a public discovery endpoint.
# Associate this IdP with AWS IAM so that the latter can validate and accept the OIDC tokens issued by Kubernetes to service accounts.
# Doing this with eksctl is the easier and best approach.
#
eksctl utils associate-iam-oidc-provider --cluster ${CLUSTER_NAME} --approve
两个区域VPC之间建立对等连接
配置Amazon Route 53,以解析到Amazon Managed Service for Prometheus的请求,以便通过VPC端点路由到新加坡Prometheus工作区
- Go to the Route53 console and choose Create hosted zone.
- In the domain name field, enter the information for the domain name that you want to route traffic for.
- Select Private hosted zone.
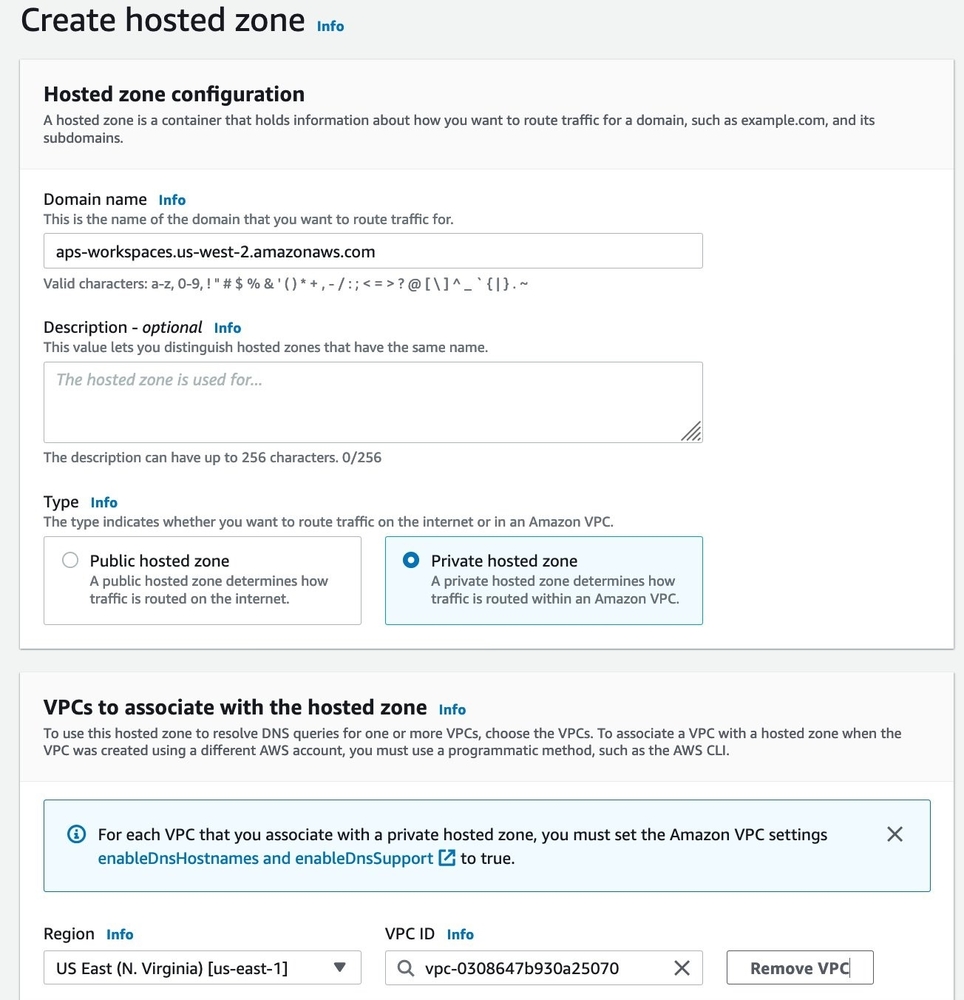
- Choose Create hosted zone.
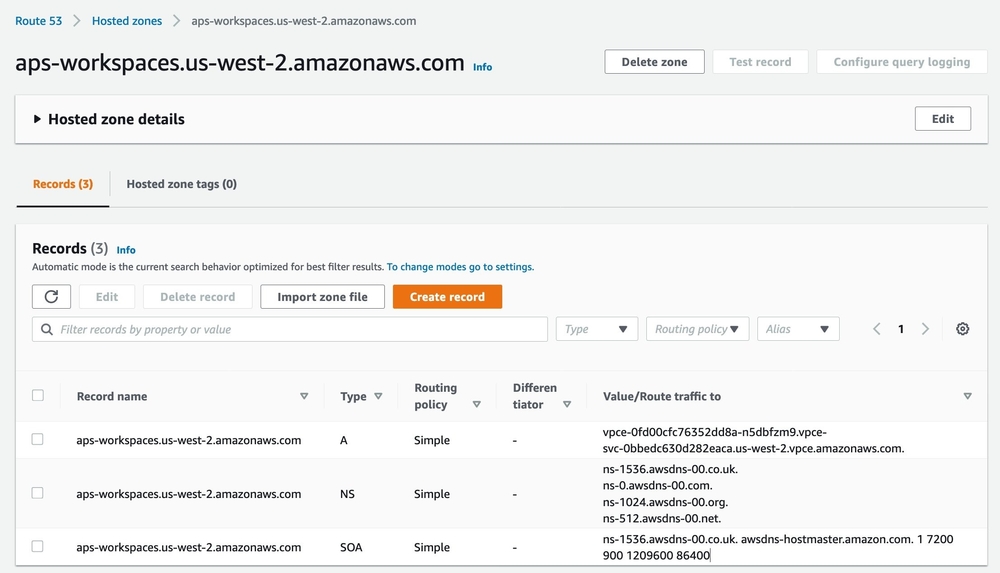
- Now we need to create an A record to route the traffic to the VPC endpoint created earlier.
- Inside the newly created hosted zone, choose Create record.
- In the Quick create record screen, choose Switch to wizard.
- In the Choose routing policy screen, select Simple routing and choose Next.
- In the Configure records screen, select Define simple record.
- In the new screen, leave the Record name field as it is.
- Select Alias to VPC endpoint in the Value/Route traffic to drop-down.
- Select Region Y where you created the VPC endpoint earlier.
- Now, select the first VPC Endpoint alias from the lookup that appears.
- Leave the Record type drop-down as it is and select Define simple record.
- Once created, your Hosted zone should look like the following screenshot:
在香港Amazon EKS集群上部署Prometheus server,并为Prometheus端点配置远程写入到新加坡Amazon Managed Service for Prometheus的端点
kubectl create ns prometheus
helm repo add prometheus-community https://prometheus-community.github.io/helm-charts
helm repo add kube-state-metrics https://kubernetes.github.io/kube-state-metrics
helm repo update
Next, we create a file called amp_ingest_override_values.yaml by running the following:
cat >> amp_ingest_override_values.yaml << EOF

## The following is a set of default values for prometheus server helm chart which enable remoteWrite to AMP
## For the rest of prometheus helm chart values see: https://github.com/prometheus-community/helm-charts/blob/main/charts/prometheus/values.yaml
##
serviceAccounts:
  ## Disable alert manager roles
  ##
  server:
        name: "amp-iamproxy-service-account"
  alertmanager:
    create: false

  ## Disable pushgateway
  ##
  pushgateway:
    create: false

server:
  remoteWrite:
    -
      queue_config:
        max_samples_per_send: 1000
        max_shards: 200
        capacity: 2500

  ## Use a statefulset instead of a deployment for resiliency
  ##
  statefulSet:
    enabled: true

  ## Store blocks locally for short time period only
  ##
  retention: 1h

## Disable alert manager
##
alertmanager:
  enabled: false

## Disable pushgateway
##
pushgateway:
  enabled: false

EOF
Execute the following command to modify the Prometheus server configuration to deploy the signing proxy and configure the remoteWrite endpoint:
IAM_PROXY_PROMETHEUS_ROLE_ARN=$(aws iam get-role --role-name amp-iamproxy-ingest-role | jq .Role.Arn -r)
WORKSPACE_ID=$(aws amp list-workspaces --alias ${AMP_WORKSPACE_NAME}| jq .workspaces[0].workspaceId -r)
helm install amp-prometheus-chart prometheus-community/prometheus -n prometheus -f ./amp_ingest_override_values.yaml \
--set serviceAccounts.server.annotations."eks\.amazonaws\.com/role-arn"="${IAM_PROXY_PROMETHEUS_ROLE_ARN}" \
--set server.remoteWrite[0].url="https://aps-workspaces.${AWS_REGION_Y}.amazonaws.com/workspaces/${WORKSPACE_ID}/api/v1/remote_write (https://aps-workspaces.${aws_region}.amazonaws.com/workspaces/$%7BWORKSPACE_ID%7D/api/v1/remote_write)" \
--set server.remoteWrite[0].sigv4.region=${AWS_REGION_Y}
在新加坡创建Amazon Managed Grafana工作区,并从Amazon Managed Service for Prometheus 工作区查询指标
- Set up an Amazon Managed Grafana workspace by following the instructions from the blog post Amazon Managed Grafana – Getting Started from the AWS Management & Governance Blog.
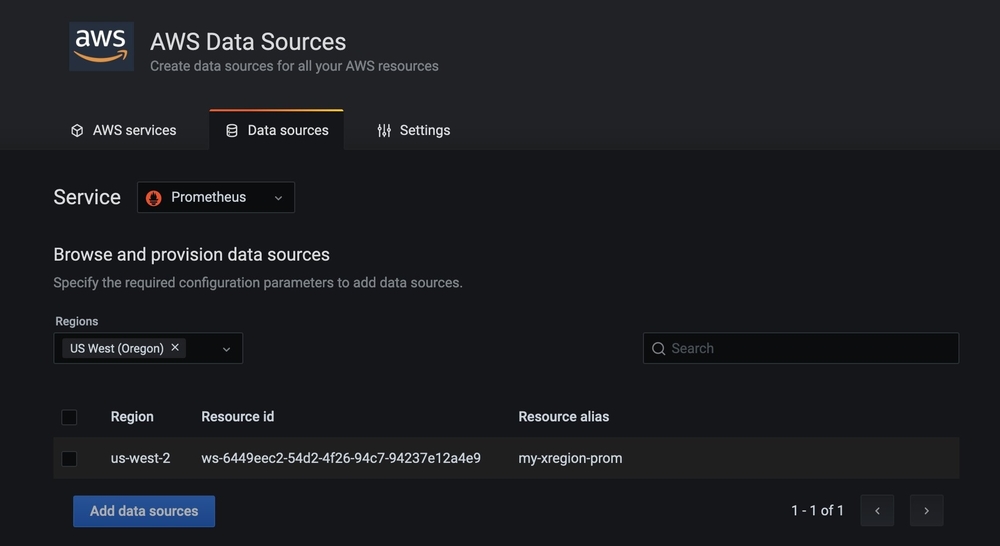
- Once you’re logged into the Amazon Managed Grafana console, add the Amazon Managed Service for Prometheus datasource by selecting AWS services under the AWS section on the left navigation bar.
- Select Prometheus under the AWS services tab.
- In the Data sources tab, select your AWS Region (Region Y) where the Amazon Managed Service for Prometheus workspace is.
- The Amazon Managed Service for Prometheus workspace will automatically appear under the drop-down. Select the check box and choose Add 1 data source to add the Amazon Managed Service for Prometheus data source.
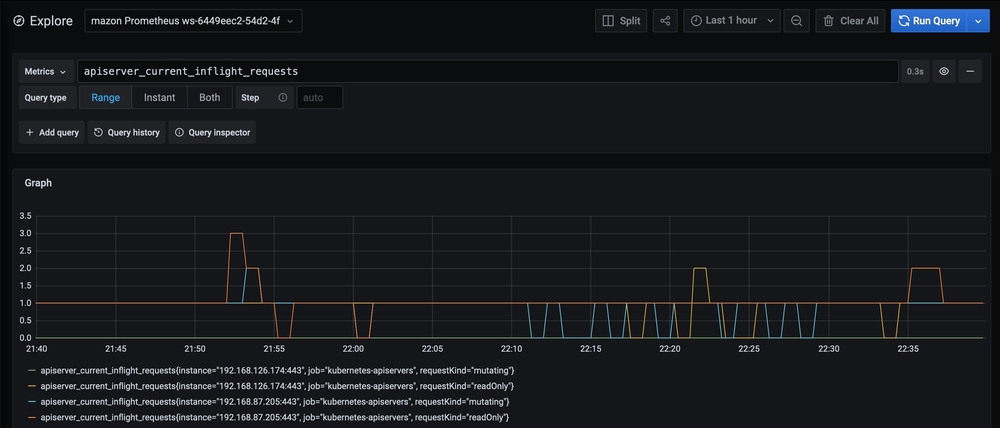
- Now choose Explore from the left navigation bar and enter the following query in to the text box:
apiserver_current_inflight_requests - You will see a screen similar to the one in the following screenshot, which shows that we are able to successfully query metrics from the EKS cluster through the Amazon Managed Service for Prometheus workspace: